Comprehensive hurricane research project proves successful!
Last week NASA concluded its GRIP (Genesis and Rapid Intensification Process) hurricane research mission aimed at gaining a better understanding of tropical cyclone behavior—how they form, evolve and strengthen, and how they weaken and die. GRIP, which launched in mid-July, promises to revolutionize tropical weather forecasts in years to come.
How it worked The GRIP mission analyzed storms with manned and unmanned aircraft as well as satellite imagery. The aircraft, ready for deployment at a moments notice, were based along the U.S. Gulf coast and northern Caribbean islands and were equipped with 15 weather instruments, ranging from an advanced microwave sounder to dropsondes—gadgets that record atmospheric and surface measurements as they fall through the atmosphere to the ocean surface.
The perfect specimens While tropical cyclone impact for the season remains quite low for U.S. coastal communities, two hurricanes, Earl and Karl were significant for GRIP's research. Earl, a category 4 storm that spun through the central and western Atlantic, was analyzed as it rapidly intensified and degraded off the southeast coast before heading northward towards the Canadian maritime region. During this time GRIP sent several aircraft into the storm, penetrating its eye and sending back critical storm data that offered insight into wind speed and direction as well as wind shear's affect on hurricanes moving swiftly through northern latitudes. Similarly, Karl, which was a strengthening category 3 at landfall, was penetrated by additional aircraft as it plowed into the Mexican coast. These aircraft captured valuable data such as cloud temperature, air pressure, humidity, precipitation, convection and sea surface temperatures. GRIP continued it's research after Karl moved inland and deteriorated, also providing perspective on how land friction affects hurricane degradation.
The seasonal scorecard The 2010 Atlantic hurricane season concludes November 31 and remains quite active, with 18 storms, of which 16 have been named. 8 of those named storms became hurricanes, of which 5 were major.
From record-breaking heatwaves to drought and fires, on a global scale the summer of 2010 will undoubtedly go down in the books as one of the most extreme for the northern hemisphere. But how extreme and how hot... and how does it compare to years prior?
According to recently released information by NASA's Goddard Institute for Space Studies (GISS), globally, June through August was the fourth-warmest summer period in GISS's 131-year-temperature record. The same months during 2009, in contrast, were the second warmest on record. The cooler 2010 summer temperatures (and by cooler I mean SLIGHTLY and UNNOTICEABLE by many) were primarily the result of the current La Niña pattern replacing El Niño which has controlled our weather for the better part of the last year or so.
Looking at this information you probably cannot help but wonder if this trend points towards a warming planet, especially when global seasonal temperatures for the spring of 2010 also were the warmest on record. It is the public's instinct to look at local temperature anomalies and draw that conclusion, but GISS says these trends have limited relevance on a global scale.
In reviewing some interesting data, I personally made note that 2010 is shaping up very similar to 2005 which was THE warmest year on record. We are looking at similar atmospheric patterns, and that includes the current influences on the Atlantic hurricane season. GISS believes 2010 will end up measuring sufficiently close to 2005 and the last few months of the year will be very telling as that is the period that brought 2005 from being one of the warmest to THE warmest.
Last week NASA and NOAA reported that the third and final spacecraft in the GOES N-P Series of geostationary environmental weather satellites known as GOES-15, has successfully completed five months of testing and has been accepted into service.
The GOES fleet help NOAA forecasters track life-threatening weather and it is one of the most useful satellites, providing a constant stream of data and imagery as it observes clouds, ocean temperatures, winds, atmospheric properties, severe storm systems, fires and many other environmental parameters covering more than 50 percent of the Earth's surface.
GOES-15 has already started to deliver high-resolution photos from space (see image above of Hurricane Danielle), including the first visible and infrared images of Earth taken by its imager instrument, and the first image of the sun taken by its solar X-ray imager instrument.
GOES-15 will be placed in an on-orbit storage location at 105 degrees west longitude should one of the operational GOES satellites degrade or exhaust their fuel. It will share a parking space with GOES-14, currently in the same storage orbit. Both satellites can be made operational within 24 hours to replace an older satellite.
Hurricane formation and movement is now largely tracked by satellites, but a new project set to launch on August 15 hopes to change that!
The project is called PREDICT and stands for the Pre-Depression Investigation of Cloud Systems in the Tropics, and is funded by the National Science Foundation (NSF) with support from the National Center for Atmospheric Research (NCAR). PREDICT will run for 45 days through September 30 and it is going to study why some tropical thunderstorms grow into the often-deadly hurricanes while many others dissipate.
Flying aboard Gulfstream aircraft, PREDICT researchers will make observations from close proximity, and above, storm systems. In addition to deploying dropsondes – parachute-borne instrument packages, the researchers will use remote sensing and cloud physics instruments to gather data on temperature, humidity, wind speed and direction, and characteristics of ice particles and their nuclei, which may include African dust.
PREDICT will coordinate its effort with two additional concurrent, but independent, missions in the region – one organized by NASA and one run by NOAA. While all three projects have independent objectives, scientists hope that the collective data will paint a more complete picture of a hurricane's life cycle.
Want to learn more? Check out this great video that explains the PREDICT concept from an experts point of view!
NASA released this week a satellite imagery movie showing the life cycle of Hurricane Alex, the first named storm of the 2010 hurricane season, and the only storm to form during the month of June. The movie was put together by a compilation of GOES-13 captures over the course of two weeks, and is a definitive example of one of the tropical-storm-in-ten which bloom into a hurricane, therefore honoring Hurricane Alex as today’s NEQ Spotlight!
After struggling across hurricane alley as Invest 93L during the last two weeks of June, Tropical Depression # 1, which formed on June 25, managed to strengthen into Tropical Storm Alex on June 26 before making landfall along the coast of Belize. Being downgraded back to a tropical depression before reaching the calm of the Gulf of Mexico, Alex quickly spun back up into a tropical storm and further strengthened into a hurricane on June 29 before making a final landfall in northeast Mexico on July 1.
Hurricane Alex's heavy rainfall flooded towns, created mudslides, caused waterways to overflow and broke records. Sadly, it also proved fatal to at least 30 people.
NASA is hopping on the hurricane bandwagon and will soon kick off a new mission aimed at getting a better grip on how tropical storms form and develop into [major] hurricanes. The mission is called GRIP and stands for Genesis and Rapid Intensification Process, and it will fly aircraft and unmanned air vehicles (for up to 20 hours straight) into the storms this summer. Grip is expected to provide a sustained, continuous look at hurricane behavior at critical times during their formation and evolution, i.e. how they strengthen, weaken and die.
The hurricane research fleet for GRIP is made up of one Global Hawk UAV, a McDonnell Douglas DC-8 and a Martin WB-57F Canberra. The six-week program, which begins on August 15, is NASA's first major US-based hurricane field campaign since 2001.
The aircraft will carry a total of 15 instruments, ranging from an advanced microwave sounder to dropsondes that take measurements as they fall through the atmosphere to the ocean surface. In order to determine how a tropical cyclone will behave, the instruments will analyze many factors, including cloud droplet and aerosol concentrations, air temperature, wind speed and direction in storms and on the ocean's surface, air pressure, humidity, lightning, aerosols, and water vapor. The data also will validate the observations from space.
The CloudSat spacecraft will provide cloud profiles of storms, which include altitude, temperatures and rainfall intensity.
Several instruments on board NASA's Aqua satellite will provide infrared, visible and microwave data that reveal such factors as temperature, air pressure, precipitation, cloud ice content, convection and sea surface temperatures.
Here we are, the last Friday in June, which means two things: we're almost one month into hurricane season and it's time for the NEQ Friday Review. Today I'll review a new insight into hurricanes that may help forecasters predict the extent of damaging winds and waves as a result of the fiercest of tropical cyclones.
Two of NASA's Jet Propulsion Laboratory (JPL) researchers, Kenneth Oslund and Philip Callahan, have developed a technique using wave height measurements from satellite altimeters to study Atlantic v.s Pacific hurricanes. They did so by combining data from multiple satellite passes over a variety of category 3 or higher storms to create composite views, or templates, of 'typical' hurricanes.
The results of their efforts support that, although equally as strong, Atlantic hurricanes are generally smaller in size than their Pacific counterparts – a likely result of higher oceanic heat content in the Pacific. In fact, storm-generated waves from Pacific hurricanes extend, on average, a distance of over 120 miles further from the storm center than those of Atlantic storms.
Interesting, the study also proved that a hurricane's strongest winds, those that create the highest waves, occur in the right front quarter of the storm – this, my friends, is also considered The Northeast Quadrant– and is one of the roots of this blog's namesake!
Check out a more in-depth look into the satellite wave data project here.
Enjoy your weekend, and remember, the 2005 hurricane season, the most active in history, didn't spin up its first hurricane until July 4 weekend. Be ready!
Earlier this month the Climate Prediction Center (CPC) announced that we officially moved into a La Niña pattern, and recent images from NASA's Jason-2 oceanography satellite verify. The opposite of El Niño, La Niña is the cooling of the equatorial Pacific Ocean.
Both El Niño and La Niña play a major role in global weather. During a La Niña, trade winds in the western equatorial Pacific Ocean are stronger than normal, and the cold water that normally exists along the coast of South America extends to the central regions. La Niñas are associated with less moisture in the air, resulting in less rain along the coasts of North and South America. They also tend to increase the formation of tropical storms in the Atlantic.
So what exactly does that mean for the United States? What impact can we expect?
An increase in the number of tropical storms as a result of La Niña boosts the chances that a storm (or hurricane) will enter the Gulf of Mexico, home to about 30 percent of U.S. oil and 12 percent of U.S. natural gas production, as well as the anomaly of an oil slick this year.
La Niña's cooling pattern often brings dryer, warmer weather to the southern half of the United States, thus increasing the wildfire threat in Florida and California.
During La Niña, the northern third of the United States often has colder winters.
Increased rainfall in the Pacific Northwest is also common during La Niña.
Experts expect the central equatorial Pacific Ocean to stay colder than normal throughout the summer and beyond, so the risk for long-lasting La Niña-type weather conditions to affect North America in coming months is quite likely.
Looks like next winter could be VERY different from last, which was largely controlled by El Niño!
Last year, a study using data from a NASA satellite showed that Arctic sea ice thinned dramatically between the winters of 2004 and 2008.
Now – a couple years later, in its first dedicated oceanographic field campaign, more than 40 NASA scientists are heading to the Arctic to further study the impact of climate change. Their five-week expedition, dubbed ICESCAPE (Impacts of Climate on Ecosystems and Chemistry of the Arctic Pacific Environment), kicks off next Tuesday (June 15) aboard a U.S. Coast Guard icebreaker, and will focus on how varying physical, chemical, and biological ice conditions affect the ecosystems in the Chukchi and Beaufort Seas. These Seas and the Arctic Ocean, unlike others, is almost completely landlocked, making it an ideal location to study ongoing climate changes in a marine ecosystem already heavily impacted by declining sea ice cover, ocean acidification, and an increase in incoming solar radiation.
NASA’s findings will ultimately help supplement the above-mentioned data that its satellites have for years collected on arctic ice (and ice-free) conditions.
A follow-up voyage is scheduled for the fall of 2011.
Earthquakes Indicate Volcanic Activity Persists While NASA Captures Stellar Satellite Image
With a series of earthquakes occurring this week inside Eyjafjallajökull, it seems there is no end in sight for the erupting volcano. In fact, over fifty quakes have been reported since Monday morning, which prove that magma is still flowing into the volcano from the Earth's mantle.
As for the eruption, there was a slight increase in explosive activity Monday, resulting in an ash plume at times shooting up 20,000 feet. At the same time, luck would have it that NASA's Moderate Resolution Imaging Spectroradiometer (MODIS) on its Aqua satellite captured the image above. In my opinion it's the best satellite image of Eyjafjallajökull's ash plume yet.
In related news, you can now purchase official Eyjafjallajökull ash online! An Icelandic Internet retailer by the name of nammi.is is selling the ash to support the search and rescue team responsible for safekeeping and restoring work in the area.
Apparently orders have been coming in from across the world... so ummm, get your ash today!
Today marks the 50th anniversary of NASA's launch of TIROS-1 from Cape Canaveral, Florida. Initially delivering a fuzzy picture of thick bands and clusters of clouds over the United States, and later capturing an image of a typhoon off the coast of Australia, TIROS (Television Infrared Observation Satellite) was the first meteorological satellite to revolutionize weather forecasting.
Since the historic NOAA-NASA collaboration in 1960, meteorologists have been able to obtain greater information about severe weather and thus have issued more accurate forecasts and warnings that save lives and protect property. Throughout the 1960s, each TIROS spacecraft carried increasingly advanced instruments and technology, and by 1965, meteorologists combined 450 TIROS images into the first global view of the world’s weather.
Throughout the 1960s NASA launched a total of ten TIROS satellites, and after the turn of the decade it began launching its series of GOES (Geostationary Operational Environmental Satellite) orbiters which further revolutionized weather forecasting and is still to this day depended upon.
NOAA and NASA continue to collaborate. NASA is expected to launch the next generation GOES-R satellites beginning in 2015. These spacecraft will have twice the clarity of today's GOES and provide more than 20 times the information.
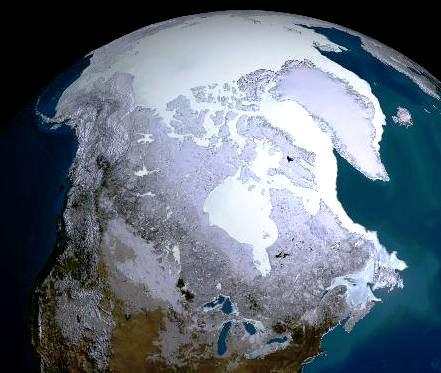
By early this month several winter storms had left snow cover over much of TheNortheast Quadrant. Mostly clear skies over the eastern United States and Canada allowed the Moderate-resolution Imaging Spectroradiometer (MODIS) on NASA’s Terra satellite this unobstructed view on March 6.
The navy blue of the eastern Great Lakes and the Atlantic Ocean contrasts with the snow cover in this true-color image. South of Lake Ontario, the Finger Lakes resemble giant claw marks in otherwise snow-covered New York. Snow appears the most opaque in Ohio, central New York, and between Lake Huron and its neighboring lakes to the east. In Canada, the mottled appearance likely results from a combination of snow cover and forest.
Terra, which launched ten years ago on Dec. 18, 1999, is a multi-national NASA scientific research satellite in a sun-synchronous orbit around the Earth. It is the flagship of NASA's Earth Observing System. Terra carries a payload of five remote sensors designed to monitor the state of Earth's environment and ongoing changes in its climate system. In the decade since Terra launched, scientists have gained insight into the intricate connections that shape our planet's climate.
Congratulations to NASA on this Terra-ific decade in orbit!
NASA yesterday launched NOAA’s latest GOES-P meteorological satellite, which promises to deliver the most awesome global images of storm development [and more] known to man!
GOES-P, which is scientifically known as the Geostationary Operational Environmental Satellite, lifted off Thursday evening from Cape Canaveral and is the third and final launch in the GOES N-P series. It will join four similar spacecraft aimed at improving weather forecasting and monitoring of environmental events in North, Central and South America, and the surrounding oceans. In doing so it will detect ocean and land temperatures, monitor space weather, relay communications and provide search-and-rescue support.
GOES-P promises to provide meteorologists with nearly continuous satellite images, as well as temperature and moisture data, enabling more accurate weather forecasts. GOES-P will also add to the global climate change databases of knowledge embraced by worldwide forecasting organizations that work to benefit people everywhere and help save lives.
I can’t wait to see these out-of-this-world images… no pun intended!
Feel like there isn’t enough time in the day??? Well now there is less.
The magnitude 8.8 earthquake that hit Chile over the weekend — killing hundreds, and leaving hundreds of thousands homeless — may have shortened the length of each Earth day, according to NASA's Jet Propulsion Laboratory scientist, Richard Gross.
Dr. Gross computed how Earth's rotation should have changed as a result of the February 27 quake. Using a complex model, he and fellow scientists came up with a preliminary calculation that the quake should have shortened the length of an Earth day by about 1.26 microseconds (a microsecond is one millionth of a second.) This might not seem like much to you and I, but consider supercomputers that operate millions of times faster where even a few of nanoseconds came make a difference. So much for sleeping in during precious microseconds we just lost forever.
Perhaps more impressive is how much the quake shifted Earth's axis. Gross calculates the quake should have moved Earth's figure axis (the axis about which Earth's mass is balanced) by 2.7 milliseconds (about 8 centimeters, or 3 inches).
Earth's figure axis is not the same as its north-south axis; they are offset by about 33 feet. Now consider the earth has shifted, but the GPS satellites have not, which means due to the angles involved there are some positional errors, not to mention that any scientific experiments requiring accurate time will need to take it into account.
Years ago Al Gore changed the world by inventing the Internet. Then he wowed us all by explaining global warming with some power point slides. Well now our good friends over at NASA found a way to use the Internet to help people better understand the causes and effects of Earth's changing climate and global warming.
The new "A Warming World" page hosts a series of news articles, videos, data visualizations, space-based imagery and interactive visuals that provide unique NASA perspectives on this evolving topic of global importance.
The page includes featured articles that explore the recent Arctic winter weather that has gripped the United States, Europe and Asia, and how El Nino and other longer-term ocean-atmospheric phenomena may affect global temperatures this year and in the future.
A new video, "Piecing Together the Temperature Puzzle," illustrates how NASA satellites monitor climate change and help scientists better understand how our complex planet works.
The page also contains a section just for kids and one for educators which seems ideal for classroom. Good stuff!
Last week when folks in The Northeast Quadrant were buried under snow, NASA launched another new mission. The Solar Dynamics Observatory (SDO) lifted off from Cape Canaveral on a five-year mission to study the sun. SDO will beam back IMAX-quality images of solar explosions and peer beneath the stellar surface to see the sun's magnetic dynamo in action.
Shortly after launch, SDO's Atlas V rocket flew past a sundog hanging suspended in the blue Florida sky and with a rippling flurry of shock waves, destroyed it.
Sundogs are formed by plate-shaped ice crystals in high, cold cirrus clouds. As the crystals drift down from the sky like leaves fluttering from trees, aerodynamic forces tend to align their broad faces parallel to the ground. When sunlight hits a patch of well-aligned crystals at just the right distance from the sun a sundog can be seen.
When the rocket penetrated the cirrus, shock waves rippled through the cloud and destroyed the alignment of the crystals and the thus the sun dog too. The whole launch video is pretty cool, but for those of you who are impatient, the awesomeness occurs around 1:50 in the video.
Within the past couple days a massive piece of ice broke off of Antarctica's Filchner Ice Shelf. The images above taken on January 12 and January 13 by NASA’s Terra and Aqua satellites captured the huge piece of ice as it was breaking away. At about 150 kilometers long by 25 kilometers wide, the piece of the ice shelf that broke away was larger than the state of Rhode Island.
The ice shelf is a portion of Antarctica’s expansive ice sheets that extend over the ocean. As fresh snow falls on the ice sheet, the weight compresses it out like pancake batter spreading on a pan. The ice shelf grows out until waves and ocean currents break off the edge, forming a new iceberg. This process is known as "ice calving" -- a sudden release and breaking away of a mass of ice from an iceberg, ice shelf or glacier. Although calving can be caused by tidal and seismic events, periodic calving and disintegration of ice masses are considered normal geological processes.
Snow cover stretched from Oklahoma to Pennsylvania when the Moderate Resolution Imaging Spectroradiometer (MODIS) on NASA’s Aqua satellite took this picture on January 10, 2010. Snow cover thins toward the south, disappearing midway through Oklahoma in the west. In the east, the snow traces an arc through Virginia up toward Pennsylvania.
Aqua is a multi-national NASA scientific research satellite in orbit around the Earth, studying the precipitation, evaporation, and cycling of water.
Freezing Temperatures... If any of you have been outside the past several days, you surely noticed it's a bit cold out. The good news is the zephyr like wind over the past weekend should be dying down, so congrats on surviving the Great Winter Wind Weekend of '10. Down here in DC, the Potomac is starting to freeze. Chunks of ice are flowing. Unfortunately, for those of you adverse to the cold you'd better hunker down and bundle up - it looks like the frigid temperatures are going to be with us for the foreseeable future.
The potential for more cold even triggered an automatic halt on Monday to trading on New York’s ICE Futures US exchange (think damaged orange crops in Florida).
Around the World... China's national meteorological office warned that temperatures in the nation's far north could fall to around minus 32 degrees Celsius. The image on the right acquired from NASA's Terra satellite on January 4, shows the record snowfall that covered Beijing and much of China after the new year.
Our friends across the pond in the UK are experiencing lows from -2 to -8C. Even in Russia where they are used to the cold, lows tonight in Moscow are expected to hover around zero Fahrenheit.
More Snow??? The upshot here (for the cold averse) looks to be the potential for more snow across the Northeast toward the end of the week. I firmly believe that as long as its going to be cold it may as well snow.
An online video talk show offering a blood pumping new look at weather from a personal perspective!
The Northeast Quadrant Radar
About The Northeast Quadrant
The Northeast Quadrant is a highly informative blog and global interactive social community for the weather obsessed, written and managed by the weather obsessed!
Near daily blog posts and news shares about ever-changing weather patterns, the evolution of dynamic storm systems, the controversy surrounding climate change; and its effects on our cities, nation and the world, The Northeast Quadrant takes you beyond the weather and brings you closer to science through its unique presentation of incredible news stories and vibrant personal experiences! With thousands of web hits directly on the blog, hundreds of Facebook fans, and Twitter followers, and an overwhelming viewer audience on YouTube, The Northeast Quadrant continues to grow!
Bookmark and subscribe to http://northeastquadrant.blogspot.com/ and enjoy! In doing so you'll join the global community from countries around the world that regularly visit The Northeast Quadrant.
What are people saying about The Northeast Quadrant?
"Congratulations to The Northeast Quadrant for making weather fun! This is not the kind of information you get from your local weatherperson." – Janette from Washington, DC
"I am in the midst of grueling Navy Weather Forecasting school. It's fun sometimes, but we don't really get into anything outside of the subject matter. I appreciate The Northeast Quadrant because it's an interesting look at weather and facts. It provides a much needed break from mundane, tedious weather lessons! Thanks Devin!" – Mack from Biloxi, Mississippi
"I really enjoy reading The Northeast Quadrant! Devin does a great job and keeps things interesting. You can see the passion he has for the tropics and that's something I always respect! I have learned as a teacher of meteorology, that you can't teach passion – you either have it, or you don't!" – Greg from Starkville, Mississippi
"Throughout all the recent Icelandic volcanic news, we at Know Your Money like to keep updated with blogs to discover their opinion of what is going on. The Northeast Quadrant offers a great deal of interest to us with regards to its intake on weather etc., and its impact on the economy... so thank you!" – Claire from United Kingdom
"I visit The Northeast Quadrant at least once a week for weather and science updates on things happening around the world. What I often find interesting is that I will read The Northeast Quadrant in the early part of the day and learn something that isn't on the news until later that night. I would be remiss if I didn't mention the fantastic pictures everyone sends in from all over!" – Staci from Union, New Jersey
"I visit The Northeast Quadrant at least 3-5 times a week. I love the pictures and funny stories, articles, quotes, etc. The blog is a good resource, it's entertaining and has valuable information. It has actually made me more interested in what is going on with the weather and why things happen." – Glen from Orem, Utah
"I find myself visiting The Northeast Quadrant more than I ever expected! I enjoy seeing Devin act so funny when he reports on various weather phenomenon. He really makes me like weather, and I particularly enjoy the photos and videos. The Northeast Quadrant has actually changed my perspective on weather and science." – Meghan from Silver Spring, Maryland
"I love The Northeast Quadrant! The information given to me is always accurate and informative. When we were listening to the news about upcoming storms this past winter, I relied on The Northeast Quadrant more than the local news. I liked watching Devin at the East River reporting and nearly getting blown away! There were always updates every few hours, and in fact I was able to prepare in advance of the storm. I also enjoy looking at and submitting personal photos pertaining to the weather!" – Robin from Edison, New Jersey
Marketing and Communications Professional; Weather Enthusiast; Recreational Storm Tracker and Reporter; and Amateur Photographer
Ever since I was a young boy I loved the weather!
There was very little that excited me more than watching The Weather Channel since its inception in 1982. Bringing weather to life was the Channel's goal, and it delivered! I remember watching the local forecast as intense lines of storms progressed towards Edison, New Jersey (where I grew up), and being called by my father to join him on the front porch as he watched the storms close in on our neighborhood. I'd run back and forth between the gusty front porch that lied beneath the darkening sky to the cool air-conditioned living room, starring at the television as I glared at the storms getting closer and closer. As the line of vibrant red's and orange's intensified, so did my interest! My obsession for weather was born, and that's where it started!
With the tools I needed at my disposal I continued to closely follow various weather phenomenon: deadly mid-western tornado outbreaks, extreme Mississippi River flooding, Hurricanes Hugo and Andrew, crippling northeastern blizzards like the '93 Superstorm, earthquakes in the Golden State, volcanoes along the Pacific Rim... you name it!
Nearly 30 years later, those who know me well would say I have not changed all that much.

 Comprehensive hurricane research project proves successful!