
A monster winter storm is taking shape in the center of the nation and will barrel its way eastward over the next two days. The storm, which is already being called historic, will feature severe blizzard conditions from Oklahoma to Missouri through Illinois and Michigan, all the way into southern Canada. Hefty snowfall amounts throughout the Plains, Midwest and interior Northeast could exceed 1 to 2 feet, meanwhile a severe ice storm is set to cripple the Ohio Valley to New York City. In this episode of The Weathervein, get the latest on this developing storm and find out what you could expect in your neighborhood! Stay safe!
Return to home
Showing posts with label Weather Records. Show all posts
Showing posts with label Weather Records. Show all posts
Monday, January 31, 2011
Thursday, January 27, 2011
More Record Snow in The Big Apple!
 Another historic snowstorm shatters NYC snowfall records!
Exactly one month after the major NYC blizzard that dumped 20" of snow on the city on December 26, another insane nor'easter moved through the the area yesterday, dumping more record snow in the metro region.
After sever hours of snowfall rates of 2-3"/hour, accompanied by thunder, lightning and wind gusts approaching 40 mph, 19" of snow fell yesterday and last night in Central Park, making this January the 'snowiest January' EVER with 36"! Further, this January is now the 'second snowiest month' EVER, by only a few tenths of an inch.
So far this season NYC has received the following snows: 1" , 20", 2", 3", 6", 1", 4", 1", 19". This brings the season total thus far to 57". On average, the city receives just under 24" of snow each winter. More snow is in the forecast this weekend and next week! If that forecast verifies, January 2011 could be not just the 'snowiest January,' but the 'snowiest month' EVER! The seasonal record is 75" during the 1995-1996 winter season. I think we could beat that this year!
Here is a short video I filmed last night from my fire escape. Check out the snow and wind! Below the video are a few photos I snapped this morning of heavy, wet snow downing trees on top of cars. This was the typical scene in New York today.


Return to home


Monday, January 3, 2011
2010 Was Fifth Warmest for NYC
In terms of weather extremes 2010 was record setting for many global regions, and New York City's Central Park was no exception. The Park recorded it's fifth warmest year on record with an average temperature of 56.7°F. The warmest year(s) on record for Central Park were ironically recorded during the years of 1990 and 1991, where the average temperature tied at 57.3°F.
So, when in 2010 was it warm? Every month except the first and last. Between February and November Central Park recorded average temperatures well above normal, while January and December stood as the only months where temperatures were below normal.
So, when in 2010 was it warm? Every month except the first and last. Between February and November Central Park recorded average temperatures well above normal, while January and December stood as the only months where temperatures were below normal.
Tuesday, October 26, 2010
BOMBOGENESIS!
Bombogenesis is defined as rapid or extreme cyclogenesis of a mid-latitude cyclone that drops in surface barometric pressure by 24 or more millibars in a 24-hour period.
A record-breaking weather event is unfolding across the upper Midwest of the United States as I type this. Surface pressures are rapidly falling and the winds are kicking up big time. Why is it happening and how significant is it?
In a case of classic bombogenesis, this storm's surface pressure has been steadily falling and is expected to fall by at least 24 millibars in 24 hours. Bombogensis is not something you often see in this part of the country, but for those in the tropics (hurricanes) and the northeast (nor'easters), it's not that unfamiliar of a term.

Current surface maps as of 10:00 a.m. ET, October 26, 2010
So how could this storm stack up with other notables in the region? In a tale of "GREAT" 'Great Lakes' Cyclones,' the developing storm could go down as the second strongest cyclone (in terms of pressure) to move through the region since record keeping began. Check it out...
1. The Great Ohio Blizzard - January 26, 1978 (958mb/28.05 inches)
UPDATE 10:30 p.m. ET, October 26, 2010: Now the #2 storm.
2. CURRENT STORM - October 26-27, 2010 (959mb/28.35 inches)
UPDATE 10:30 p.m. ET, October 26, 2010: The current storm has become the #1 storm at 955mb/28.20 inches.
3. Armistice Day Storm - November 11, 1940 (967mb/28.55 inches) and Anniversary Storm - November 10, 1988 (967mb/28.55 inches)
4. Cyclone of 1913 - November 7-9, 1913 (968mb/28.60 inches)
5. Edmund Fitzgerald Storm - November 10, 1975 (980mb/28.95 inches)
Speaking of the Edmund Fitzgerald Storm, check out his tribute...
Return to home
A record-breaking weather event is unfolding across the upper Midwest of the United States as I type this. Surface pressures are rapidly falling and the winds are kicking up big time. Why is it happening and how significant is it?
In a case of classic bombogenesis, this storm's surface pressure has been steadily falling and is expected to fall by at least 24 millibars in 24 hours. Bombogensis is not something you often see in this part of the country, but for those in the tropics (hurricanes) and the northeast (nor'easters), it's not that unfamiliar of a term.

Current surface maps as of 10:00 a.m. ET, October 26, 2010
So how could this storm stack up with other notables in the region? In a tale of "GREAT" 'Great Lakes' Cyclones,' the developing storm could go down as the second strongest cyclone (in terms of pressure) to move through the region since record keeping began. Check it out...
1. The Great Ohio Blizzard - January 26, 1978 (958mb/28.05 inches)
UPDATE 10:30 p.m. ET, October 26, 2010: Now the #2 storm.
2. CURRENT STORM - October 26-27, 2010 (959mb/28.35 inches)
UPDATE 10:30 p.m. ET, October 26, 2010: The current storm has become the #1 storm at 955mb/28.20 inches.
3. Armistice Day Storm - November 11, 1940 (967mb/28.55 inches) and Anniversary Storm - November 10, 1988 (967mb/28.55 inches)
4. Cyclone of 1913 - November 7-9, 1913 (968mb/28.60 inches)
5. Edmund Fitzgerald Storm - November 10, 1975 (980mb/28.95 inches)
Speaking of the Edmund Fitzgerald Storm, check out his tribute...
Return to home
Friday, October 8, 2010
17, 15, 8, 5
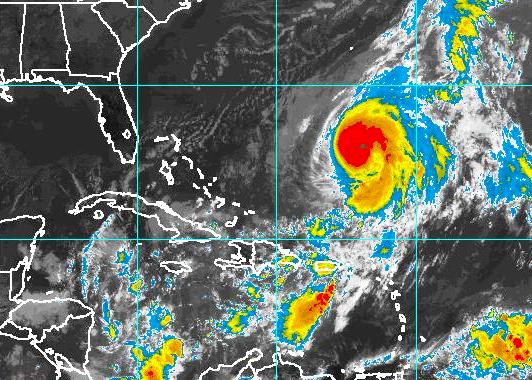 You might be wondering what the numbers in the title of this post refer to. Well wonder no more because I'm going to tell you these numbers reference the scorecard for the 2010 Atlantic hurricane season – a season that will go down in the record books as one of the most active in history!
Wait, what!? How can it be one of the most active?
You mean you haven't heard that more than half the storms, major hurricanes included, have gone out to sea as 'fish storms?' That's right... it's been a very active hurricane season but with little U.S. impact, who knew?!
With the formation of Hurricane Otto today, the 2010 Atlantic hurricane season now features a total of 17 storms, 15 of which have been named and of those, 8 became hurricanes. Of those hurricanes, 5 were majors (category 3, i.e. 115 mph or higher). A typical hurricane season produces about 10 storms, of which 6 become hurricanes.
Before the start of hurricane season experts warned of the threat of not only an active season but a very high impact one, however, as mentioned and observed, U.S. impact has been quite minimal outside of a few tropical storms, a depression and glancing blow from Hurricane Earl.
While we are hitting the numbers big time, somewhat unexpected atmospheric conditions have steered a great number of storms away from U.S. coastlines. Who's complaining right? Well, aside from the storm chasers and weather enthusiasts!
Hurricane tracks are greatly influenced by the aforementioned atmospheric conditions. The upper level currents steer hurricanes in a variety of ways and storm tracks are highly dependent on where the storms form and the steering currents at that particular time. According to National Hurricane Center (NHC) Director, Bill Read, with the weather pattern that was in place and the fact that this season's storms formed so far out to the east, it's not surprising that they turned off to the north. As soon as you find a weakness in the big high (known as the Bermuda High) you'll get that effect. This follows the same methodology that Greg Nordstrom and I refer to often in The Weathervein. When storms form east of 35W longitude they will 9 out of 10 times curve out to sea.
Time will tell what the remainder of hurricane season will bring but we only have 6 names left on the list before they are used up. Those names are Paula, Richard, Shary, Tomas, Virginie and Walter. Thereafter we would be required to begin using the Greek alphabet as we did only one time before – in 2005. However, time is running out.
Regardless, always be hurricane ready!
Return to home
Monday, October 4, 2010
Measuring up the Summer of 2010!
 From record-breaking heatwaves to drought and fires, on a global scale the summer of 2010 will undoubtedly go down in the books as one of the most extreme for the northern hemisphere. But how extreme and how hot... and how does it compare to years prior?
According to recently released information by NASA's Goddard Institute for Space Studies (GISS), globally, June through August was the fourth-warmest summer period in GISS's 131-year-temperature record. The same months during 2009, in contrast, were the second warmest on record. The cooler 2010 summer temperatures (and by cooler I mean SLIGHTLY and UNNOTICEABLE by many) were primarily the result of the current La Niña pattern replacing El Niño which has controlled our weather for the better part of the last year or so.
Looking at this information you probably cannot help but wonder if this trend points towards a warming planet, especially when global seasonal temperatures for the spring of 2010 also were the warmest on record. It is the public's instinct to look at local temperature anomalies and draw that conclusion, but GISS says these trends have limited relevance on a global scale.
In reviewing some interesting data, I personally made note that 2010 is shaping up very similar to 2005 which was THE warmest year on record. We are looking at similar atmospheric patterns, and that includes the current influences on the Atlantic hurricane season. GISS believes 2010 will end up measuring sufficiently close to 2005 and the last few months of the year will be very telling as that is the period that brought 2005 from being one of the warmest to THE warmest.
Here are some links to previous posts I've written on the extremes of summer 2010!
Heat Wave to Continue Choking mid-Atlantic, Northeast U.S. (July 6, 2010)
NEQ Friday Review, V.10 (July 9, 2010)
Extreme Heat Could Become Summer's Norm (July 22, 2010)
Russia Heat Wave is OUT OF CONTROL! (August 10, 2010)
Global Extremities of Summer 2010 (August 17, 2010)
2010 U.S. Summer Review (September 15, 2010)
Return to home
Monday, September 27, 2010
The Atlantic Basin Goes Silent... But Not For Long
 After a slow start to a hurricane season that was hyped to be anything but slow, today marks the first full day since the development of Tropical Depression #6 on August 21 (which would later become Hurricane Danielle) that we've gone without a named storm in the Atlantic basin. Although we almost did it between September 5–6 when Hurricane Earl dissipated in the north Atlantic, we were surprised when Tropical Depression #10 (which would later become Tropical Storm Hermine) quickly spun up in the southwestern Gulf of Mexico before making landfall in extreme northeastern Mexico. This marks a total of 36 days having a named storm, the longest such period since the 2002 Atlantic hurricane season, which had remained completely active for 45 days from August 29 through October 12.
We are well into an above-average Atlantic hurricane season with 13 named storms and two unnamed tropical depressions, and there are only eight more names available for use before we'd need to break into Greek alphabet, which has only been done once in history – during the epic 2005 Atlantic hurricane season. With that said, today's break in activity leaves us on edge after yesterday's degeneration of both Lisa and Matthew, wondering where Nicole is... and will Otto follow?
According to the National Hurricane Center (NHC) there is an increasingly likely chance we'll see our next named storm this week as an area of convection continues to flare up in the northwest Caribbean Sea which in the short-term seems to have its eyes on the southeastern Gulf coast. Meanwhile, a very small area of convection flared overnight in the central Atlantic, but development of this system is not likely in the near-term.
There is not yet an official invest on the system in the Caribbean but by day's end I would expect to see 96L pop up! At that time the computer models should have a better handle on what the system might do – where it might go, how fast it might develop and how strong it could become. To that extent I encourage all interests in the northwest Caribbean and Gulf of Mexico to monitor possible development in this region as the break in tropical activity seems to be short-lived!
[UPDATE #1: As of 3:30 p.m. ET 09-27-10, we officially have 96L invest.]
[UPDATE #2: As of 11:00 a.m. ET 09-28-10, we officially have Tropical Depression #16.]
I'll leave you with 2010 Atlantic hurricane season scorecard, courtesy of The Weather Channel:
| Average (1966–2009) | 2010 | |
| Named Storms | 8 | 19 |
| Hurricanes | 4 | 7 |
| Major Hurricanes | 1 | 5 |
Wednesday, September 15, 2010
2010 U.S. Summer Review
 2010 was the fourth warmest U.S. summer on record!
NOAA's National Climatic Data Center (NCDC) confirmed this week that the summer of 2010 was, as expected and fully observed by many... HOT!
Published in NOAA's State of the Climate report and based on records dating back to 1895, the NCDC notes that although the entire country experienced the fourth warmest summer on record, three climate regions in the continuous United States had temperatures in the top five: the southeast (warmest), the central (third warmest) and the northeast (fourth warmest). Several cities broke summer temperature records, including New York, Philadelphia, Trenton, Wilmington, Tallahassee and Asheville.
Here are some highlights from the report:
NCDC's Climate Extremes Index (CEI) for summer 2010 was about one-and-a-half times its historical average
- The northeast climate region experienced its warmest January-August period with an average temperature more than 3.4°F above the long-term average
- The majority of the U.S. had above-average temperatures last month. No state experienced an average temperature significantly below its long-term average
- Maine, New Hampshire, Vermont, Rhode Island, Connecticut and New Jersey each had their warmest year-to-date period and all of the Northeastern states ranked in the top ten percent of warmest periods on record
- Only Florida and Texas had below normal temperatures for the entire year so far
It should be noted that several weather forecasting models predict cooling in months and years ahead, so if you're like me and found this past summer difficult to deal with, relief might be in sight!
Return to home
Friday, July 16, 2010
NEQ Friday Review, V.11
 NYC 2010 (so far) – ‘Extreme’ly Record Setting
If 2010 is any indication of the diversity of seasons the northeast United States experiences, I don’t know what is! But wait, maybe 2010 isn’t a good example – it’s been a year of weather extremes and records, especially for cities like New York. But nonetheless, it’s made for an interesting first seven months of the year and this week’s NEQ Friday Review, takes a look back at the Big Apple’s weather (since that is where I’m blogging from) from January through July – through my eyes, as a storm watcher, blogger and photographer.
After a record-breaking blizzard in late December, New York kicked off the year with a significant snowstorm along Long Island, which I dubbed the “Palindrome Nor’easter,” having occurred on 01-02-2010 (which backwards is configured the same).
After a downright cold, nasty start to January, the polar jet retreated back into Canada, thus allowing a nice mid-January thaw, embraced by many New Yorkers as depicted in this video blog post.
The thaw wouldn’t last long as February approached. The month was literally snow and blizzard extreme! Cities from Washington, DC to New York, including Baltimore, Philadelphia and Wilmington, all saw record-breaking snowfall.
By Wednesday, February 3 snowstorm extravaganza was upon us and the next several weeks looked ominous. As the first week of the month progressed it became more evident a blizzard was to take shape and surely it did just that. But it didn’t stop there! As we moved into the second week of the month another blizzard took shape, smacking the Big Apple with heavy snow and wind, and the storm was epic! However, only a couple weeks would go by before the big daddy “Snowicane” would for nearly three days straight deliver a historical blow to the NYC-metro! Keep reading…
It all came to fruition on February 24 as computer models defined a tricky forecast ahead. A complex storm was developing and NYC sat on the edge of what could be a heavy rain or a crippling blizzard event. Well, by just a few miles (yes, literally only a few) we were in the snow... and boy did it snow! While the city was enduring a raging snowstorm, Nassau County, Long Island was experiencing a heavy, windswept rain spiraling in from the Atlantic – the Snowicane had begun, and just 12 hours into the storm the expected snowfall totals were upped by the hour. The next day the snow continued and with 17” of snow on the ground in 24 hours, we were only half way into the storm, but records were already starting to break! By the end of the storm it proved historic, and as we rounded out the month, it was among the top four greatest snowfalls NYC ever recorded!
March was no quieter as it came in like a lion when NASA’s Terra satellite captured this image of early spring snow cover in the northeast! The first of somewhat warmer-core nor’easters moved onshore near NYC on March 11, which I dubbed the “Daylight Savings Nor'easter.” The storm was so fierce that the constant easterly fetch off the Atlantic brought the ocean onshore and raised wave heights to near 20 feet, while coastal communities experienced damaging hurricane force winds knocking down power and flooding many. And to add to the misery, another major coastal deluge took shape towards the end of the month as the March lion still roared.
Record-heat surged northward in early April, forcing the mercury into the 90s for cities from Washington, DC to New York. The mini heat wave was even responsible for pushing DC’s cherry blossoms into early peak. By the end of the month it was recorded as the warmest April ever!
May and June were relatively calm months, storm-wise... and boy did we deserve it. But by the time the period closed out, more record warmth was recorded and the entire year had thus far been classified as the hottest in history!
July began on a hot note too – a very, very, very hot note! Beginning 4th of July weekend and continuing through the first full week of the month, a massive and oppressive heat wave literally began choking the mid-Atlantic and northeast. By Tuesday, July 6, high temperatures of up to 103 degrees in the New York City area broke or tied ALL records set back in 1999 at ALL National Weather Service climate reporting sites. The Big Apple was literally baking, sizzling and frying, and by Thursday, July 8 the heat wave began winding down, and in its wake shattering over 300 daily weather records across the northeast.
Well, there you have it! An ‘extreme’ly record setting 2010 for not only NYC, but for the entire northeast and mid-Atlantic. What does the rest of the year hold? Time will tell but you can bet more extremes are in store for someone, someplace!
Have a great weekend!
Return to home
Friday, July 9, 2010
NEQ Friday Review, V.10
 You didn't think this week's NEQ Friday Review would be about anything other than this past week's heatwave... did you?!
As pretty much the entire world is aware by now, a massive heatwave engulfed the northeast and mid-Atlantic United States this past week. The heatwave generally kicked off on Sunday, July 4 and it was not until yesterday, Thursday, July 8 that it began winding down. In its wake the heatwave shattered and tied an enormous amount of daily temperature records, including 33 on Monday, 131 on Tuesday and as many as 151 on Wednesday.
Sure heatwaves have plagued the region in years past, and even in 2010 alone some U.S. cities have already experienced similar waves, but this one was pretty special, and dare I say, could actually be repeated again before the summer is over. Why so special? Just check out these readings...
| Sun. 7/4 | Mon. 7/5 | Tues. 7/6 | Wed. 7/7 | Thurs. 7/8 | |
| New York (Central Park) | 96° | 99° | 103° | 100° | 88° |
| Newark (EWR Airport) | 101° | 102° | 103° | 101° | 86° |
| Philadelphia (PHL Airport) | 96° | 98° | 102° | 103° | 89° |
| Baltimore (BWI Airport) | 98° | 100° | 105° | 101° | 93° |
| Washington, DC (DCA Airport) | 94° | 99° | 102° | 102° | 93° |
What a week it was! A cool down is in store this weekend but temperatures are still expected to be hot by many standards. Expect lots of upper 80s and lower 90s... but hey, I guess it'll feel better than it did this past week. And remember, with such a hot, dry air mass in place, the next big concern for the remainder of the summer could be drought.
2010 is definitely shaping up to be record-breaking and memorable by many weather extremes!
Enjoy your weekend, and stay cool!
Wednesday, July 7, 2010
Big Apple Baking, Sizzling, Frying...
The mid-Atlantic and northeast United States is well into the fourth day of a historic heatwave and yesterday, Tuesday, July 6, high temperatures of up to 103 degrees in the New York City area broke or tied ALL records set back in 1999 at ALL National Weather Service (NWS) climate reporting sites: JFK (JFK Airport - Queens), LGA (La Guardia Airport - Queens), EWR (Newark Airport - Newark, New Jersey), Central Park (Manhattan), Islip (Long Island) and Bridgeport (Connecticut).
For many in the New York metro region, the day was marked as the hottest since August 9, 2001. Ironically, the day was also the anniversary of the hottest temperature ever recorded, which was 106 back in 1936.
Last night I took to the streets and snapped these photos of the hot, summer sun baking, sizzling and frying the Big Apple; and recorded the video blog post below, which further describes the massive heatwave and its far-reaching effects.


For many in the New York metro region, the day was marked as the hottest since August 9, 2001. Ironically, the day was also the anniversary of the hottest temperature ever recorded, which was 106 back in 1936.
Last night I took to the streets and snapped these photos of the hot, summer sun baking, sizzling and frying the Big Apple; and recorded the video blog post below, which further describes the massive heatwave and its far-reaching effects.


Friday, May 21, 2010
NEQ Friday Review, V.3
 I am on the train this morning riding Amtrak's Northeast Corridor from New York City to Boston, as I embark on a week of business meetings. A gorgeous morning indeed, the skies are deep blue and as we pulled away from the Big Apple just about an hour ago, the sunkissed skyline was magnificently displayed in my left window while the edgy coastline of Long Island lay to my right. Check out this photo that I snapped on my iPhone as the train was pushing away from the city.
In this week's NEQ Friday Review I am actually going to review last month. Did you know that since record-keeping began in 1880, April 2010 was the warmest April EVER recorded across the globe, and the second consecutive warmest month? It's true!
For the United States specifically, it was the 14th warmest April with five states recording their warmest: Illinois, Maine, Rhode Island, Connecticut, and New Jersey. Sixteen other states had their top 10 warmest.
Additionally, no other period from January through April has been warmer on planet Earth. This means that 2010 is on track to be the warmest year ever! Hard to believe when the year kicked-off with sub-freezing temperatures and epic blizzards, but hey... that's just here – we're talking globally now!
One other interesting fact – the decade beginning in 2000 has also been recorded as the warmest.
Global warming? Climate change? You decide...
Monday, March 1, 2010
From February Fury to March Madness
We all know that February was one of the harshest winter weather months the Eastern third of the country has seen in many, many years. Just look at the following two graphics supplied today by The Weather Channel.


In the first graphic, check out the temperature extremes and just how much of the nation was affected by temperatures running well below average. That, coupled with unusual heavy snowfall amounts as a result of back-to-back-to-back Nor'easters, left major U.S. cities from the Ohio Valley to the Mid-Atlantic and Northeast with record setting Februaries. The second graphic shows the states that reported their all time greatest snowfalls for the month of February, as well as those that reported their all time snowiest month ever!


Now as we enter the official start of the meteorological spring (March 1), we also enter tornado season! March tends to host some of the year's most volatile weather across the lower 48. The transition month welcomes cold surges from the north and more frequent warm surges from the south. The clash of these air masses typically sets up across the plains and southeast states before migrating northward and westward later in Spring.

Here's to a crazy Winter and a hopefully crazier Spring!
Friday, February 26, 2010
Snowicane Breaks Records in NYC!
UPDATE 11:00 A.M. (2-27-10) The National Weather Service in New York City has updated its record books once again! Yesterday's snowfall also broke daily records for that day particularly. 11.5 inches of snow fell yesterday alone, breaking the old record of 8.4 inches set in 1991.
UPDATE 6:00 P.M. At 21 inches this snowstorm is now tied for the third heaviest for New York City. Below is where we stand among the top 3.
1. 26.9 inches in February 2006
2. 26.4 inches in February 1947
3. 21 inches in March 1888 AND TODAY, February 26, 2010
Original post:
As of 2:00 p.m. 20.8 inches of snow was reported at Central Park, making the Snowicane the fourth heaviest (so far) snowstorm on record! The all time record stands at 26.9" on February 11 – 12, 2006. We will continue to climb towards that over the next several hours and through the evening – possibly exceeding it by tomorrow morning. Even if we do not exceed the all time heaviest snowfall, as the snow does continue to fall, the Snowicane may very well at least slip into the top three!
Speaking of records, I’ve got another one for you! Regardless how much more snow falls from this storm, the Snowicane has allowed the previous monthly record snowfall of 30.5 inches in March 1896 to be squashed! February 2010 is now the all time snowiest month ever recorded with a record 35.9 inches (so far)!
As snow continues to fall these figures and records will be updated!
UPDATE 6:00 P.M. At 21 inches this snowstorm is now tied for the third heaviest for New York City. Below is where we stand among the top 3.
1. 26.9 inches in February 2006
2. 26.4 inches in February 1947
3. 21 inches in March 1888 AND TODAY, February 26, 2010
Original post:
As of 2:00 p.m. 20.8 inches of snow was reported at Central Park, making the Snowicane the fourth heaviest (so far) snowstorm on record! The all time record stands at 26.9" on February 11 – 12, 2006. We will continue to climb towards that over the next several hours and through the evening – possibly exceeding it by tomorrow morning. Even if we do not exceed the all time heaviest snowfall, as the snow does continue to fall, the Snowicane may very well at least slip into the top three!
Speaking of records, I’ve got another one for you! Regardless how much more snow falls from this storm, the Snowicane has allowed the previous monthly record snowfall of 30.5 inches in March 1896 to be squashed! February 2010 is now the all time snowiest month ever recorded with a record 35.9 inches (so far)!
As snow continues to fall these figures and records will be updated!
Monday, February 15, 2010
January 2010 Was Warmest Month In 32 Years
On its path to breaking records set 32 years ago, January 2010 was recorded as the warmest month across the globe since 1978... and it's being attributed to the strong El Niño climate pattern we are currently experiencing.
The main heat in January is said to have come from the subtropical areas, especially from the Sahara through Arabia and South Asia.
Meanwhile in the United States, nearly three quarters of the nation is snow covered and for the first time in 14 years, Lake Erie, with an average depth of 62 feet, completely froze over!
And these crazy extremes are why we love weather!
In a USA Today article published on Friday, it states that according to climatologists, the Earth was about 1.3 degrees above average last month. Sounds a bit skeptical to those of us in the United States and Europe that have been experiencing winter weather extremes in the form of record breaking low temperatures and snowfall. But our weather conditions are only a very small fraction of Earth's overall dynamic atmospheric environment.
The main heat in January is said to have come from the subtropical areas, especially from the Sahara through Arabia and South Asia.
Meanwhile in the United States, nearly three quarters of the nation is snow covered and for the first time in 14 years, Lake Erie, with an average depth of 62 feet, completely froze over!
And these crazy extremes are why we love weather!
Thursday, February 11, 2010
Blizzards Shatter I-95 Weather Records!
Yesterday’s blizzard, the second to slam the I-95 Corridor from Washington, DC to New York City within just a few days, marked the third severe snowstorm this winter to slam that region (the first being the December 19, 2009 blizzard).
Yesterday’s storm dumped an additional 10.8 inches on Washington, DC – a city that received more than double that amount of snow this past weekend. The extreme events concluded that this winter is now the national capital’s snowiest, with a total of 55.9 inches. This broke the old all-time winter snowfall of 54.4 inches set in 1898-1899.
Baltimore, MD shattered its previous all-time snowiest winter record as well. The 19.5 inches of snow that fell there during the past 24 hours brought this winter's snow total to 79.9 inches. The winter of 1995-96 and its 62.5 inches recently held the record.
15.8 inches of snow fell on Wednesday in Philadelphia. That brings this winter's snowfall total to 71.6 inches, breaking the previous record of 65.5 inches set in 1995-1996.
This winter is also now the all-time snowiest in Atlantic City, NJ and Wilmington, DE. So far this winter these cities received 48.7 inches and 66.7 inches, respectively.
I am sure I don’t have to remind anyone that winter is not over yet…
Yesterday’s storm dumped an additional 10.8 inches on Washington, DC – a city that received more than double that amount of snow this past weekend. The extreme events concluded that this winter is now the national capital’s snowiest, with a total of 55.9 inches. This broke the old all-time winter snowfall of 54.4 inches set in 1898-1899.
Baltimore, MD shattered its previous all-time snowiest winter record as well. The 19.5 inches of snow that fell there during the past 24 hours brought this winter's snow total to 79.9 inches. The winter of 1995-96 and its 62.5 inches recently held the record.
15.8 inches of snow fell on Wednesday in Philadelphia. That brings this winter's snowfall total to 71.6 inches, breaking the previous record of 65.5 inches set in 1995-1996.
This winter is also now the all-time snowiest in Atlantic City, NJ and Wilmington, DE. So far this winter these cities received 48.7 inches and 66.7 inches, respectively.
I am sure I don’t have to remind anyone that winter is not over yet…
Monday, February 1, 2010
Record Low National Drought!
The stormy pattern affecting the nation over the past several months has proved extremely helpful in fighting the national drought, which is at an all-time low! 

A drought, which is an extended period of months or years when a region notes a deficiency in its water supply, has in recent years been especially harsh in the desert southwest, including California, Nevada and Arizona; the inter-mountain west states of Utah and New Mexico; and the gulf states from Georgia to South Carolina.
As of January 26, The U.S. Drought Monitor, which measures drought on a scale from D0 (abnormally dry) to D4 (exceptionally dry), indicates that only 9.15% of the country is in moderate to exceptional drought. This is a 10-year record low percentage of drought in the United States since the Drought Monitor report began in 1999.
The Weather Channel says much of this drought alleviation can be attributed to the recent western storminess that provided days of heavy snow and excessive rains across the southwest. Arizona went from 88% of the state in severe or worse drought to just 15.7% in one week, while California plummeted from 63.2% to 19.4%.
Thursday, January 28, 2010
Totally Cool Utah Weather Facts!
What better way to learn more about Utah's weather than to ask the locals? And did you know a very famous "weather" movie was filmed here in the Beehive State?
Check out this video blog post and learn a little more about Utah's climate, its record highs and lows, its average and exceedingly average snowfall, and even its rare tornadic history!
By the end of the video I'm sure you'll be feeling as EMUtional as I was!
Check out this video blog post and learn a little more about Utah's climate, its record highs and lows, its average and exceedingly average snowfall, and even its rare tornadic history!
By the end of the video I'm sure you'll be feeling as EMUtional as I was!
Subscribe to:
Posts (Atom)


